
02 Power BI – ServiceSpot Call Center Analytics Dashboard
Background
This project was developed as part of a school assignment, where I was tasked with building a comprehensive Power BI solution for an IT company named ServiceSpot. My mission was to consolidate and transform the data, and create a user-friendly report to help management monitor performance and improve service quality.
1. Data Modeling and Transformation
- Connected and merged multiple data sources using Power Query.
- Applied necessary transformations to prepare clean, analysis-ready tables.
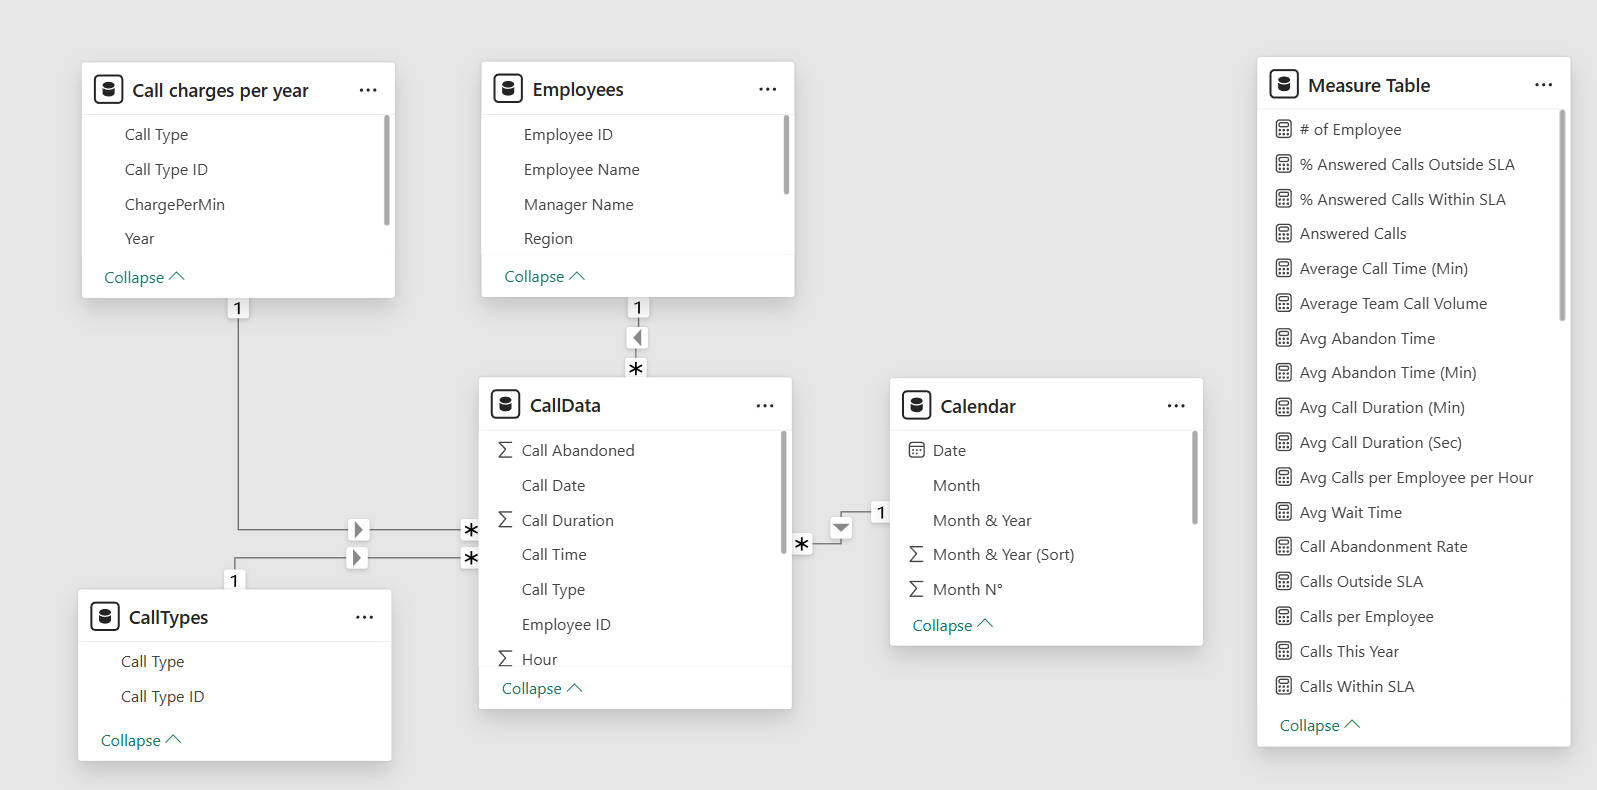
- Designed a star-schema data model with a single fact table, adhering to best practices for simplicity and performance.
- Created DAX measures to answer key business questions
2. Report Design and User Experience
To ensure a smooth and intuitive exploration experience for business users, I structured the dashboard into six interactive report pages, each serving a specific analytical purpose:
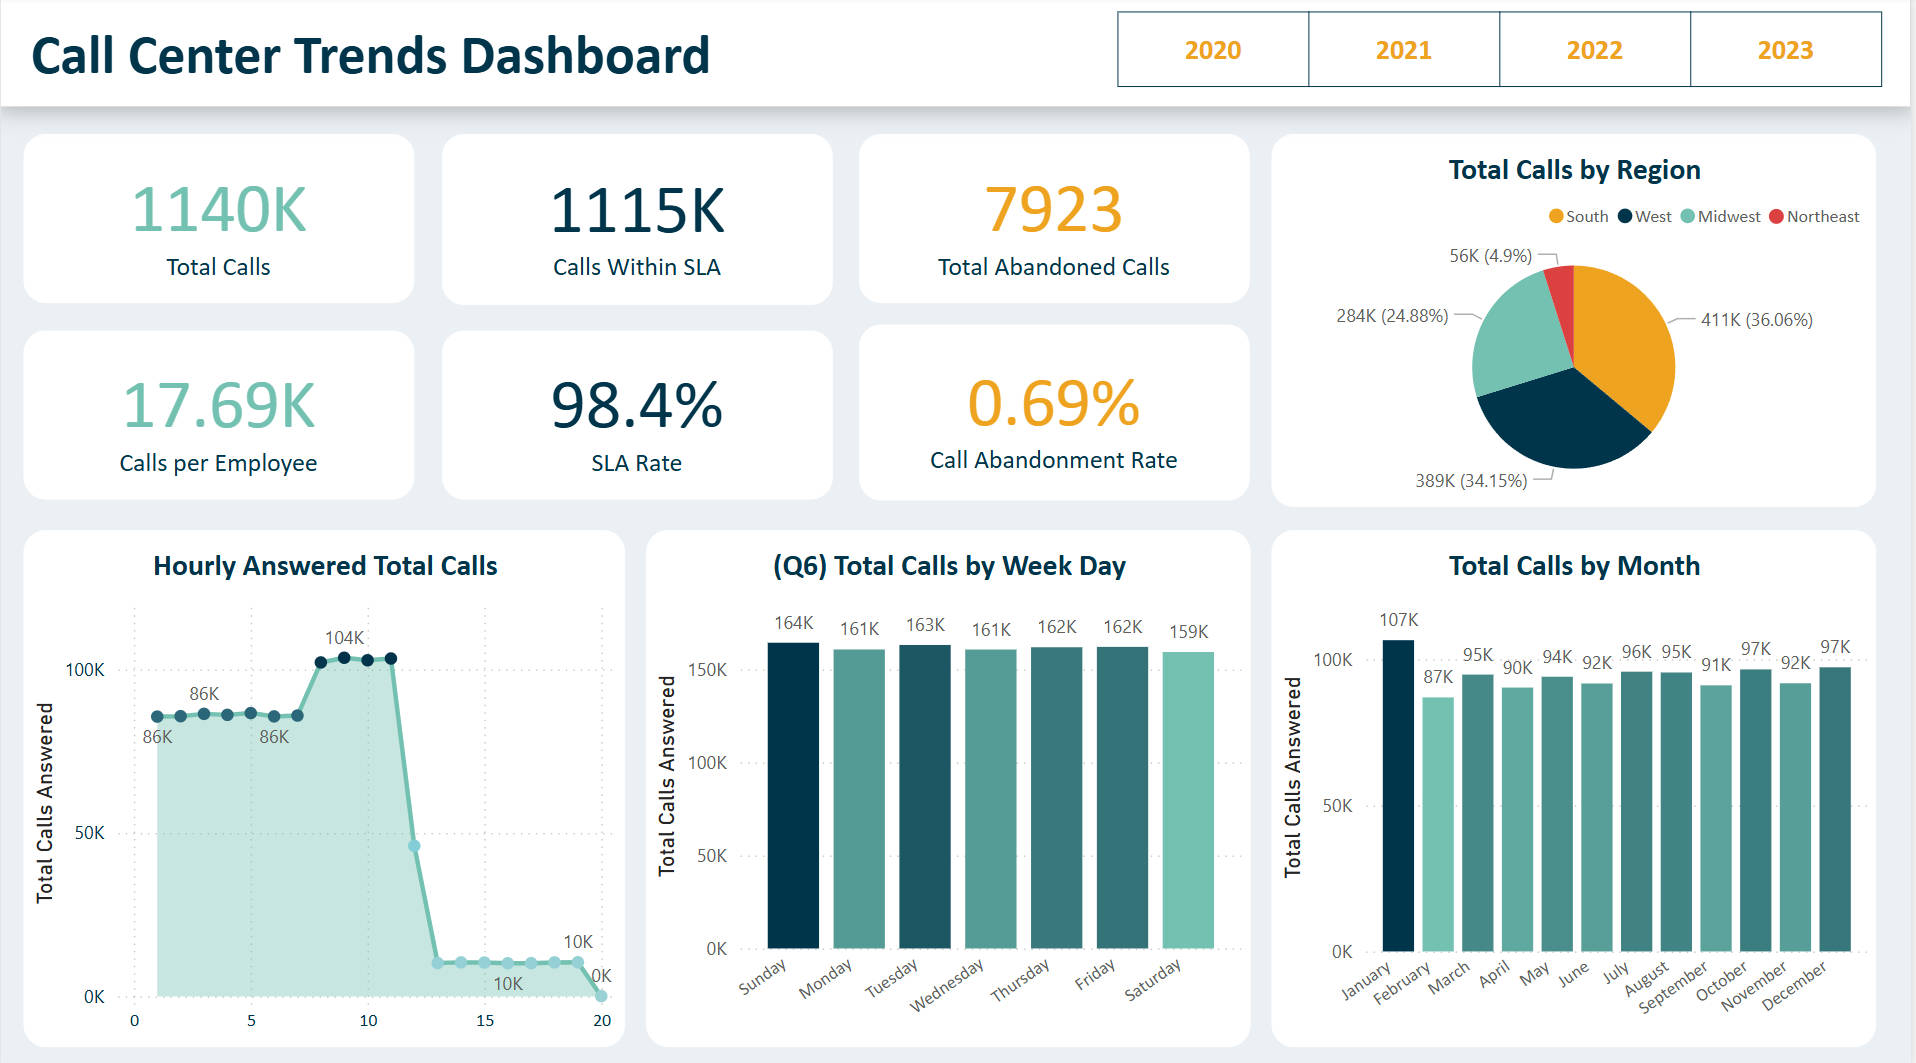
(1) Overview
A high-level summary page offering a bird’s-eye view of key KPIs, including total calls, SLA compliance rate, and average wait/call duration. This page acts as an entry point for executives to quickly assess the overall performance of the call center.
(2) Total Calls
Focused on the volume and distribution of calls, this page breaks down inbound calls by date, time of day, weekday, and call type. A special highlight is the time-of-day segmentation (early morning, late morning, early afternoon, late afternoon, evening), which uncovers customer behavior trends and peak traffic periods.
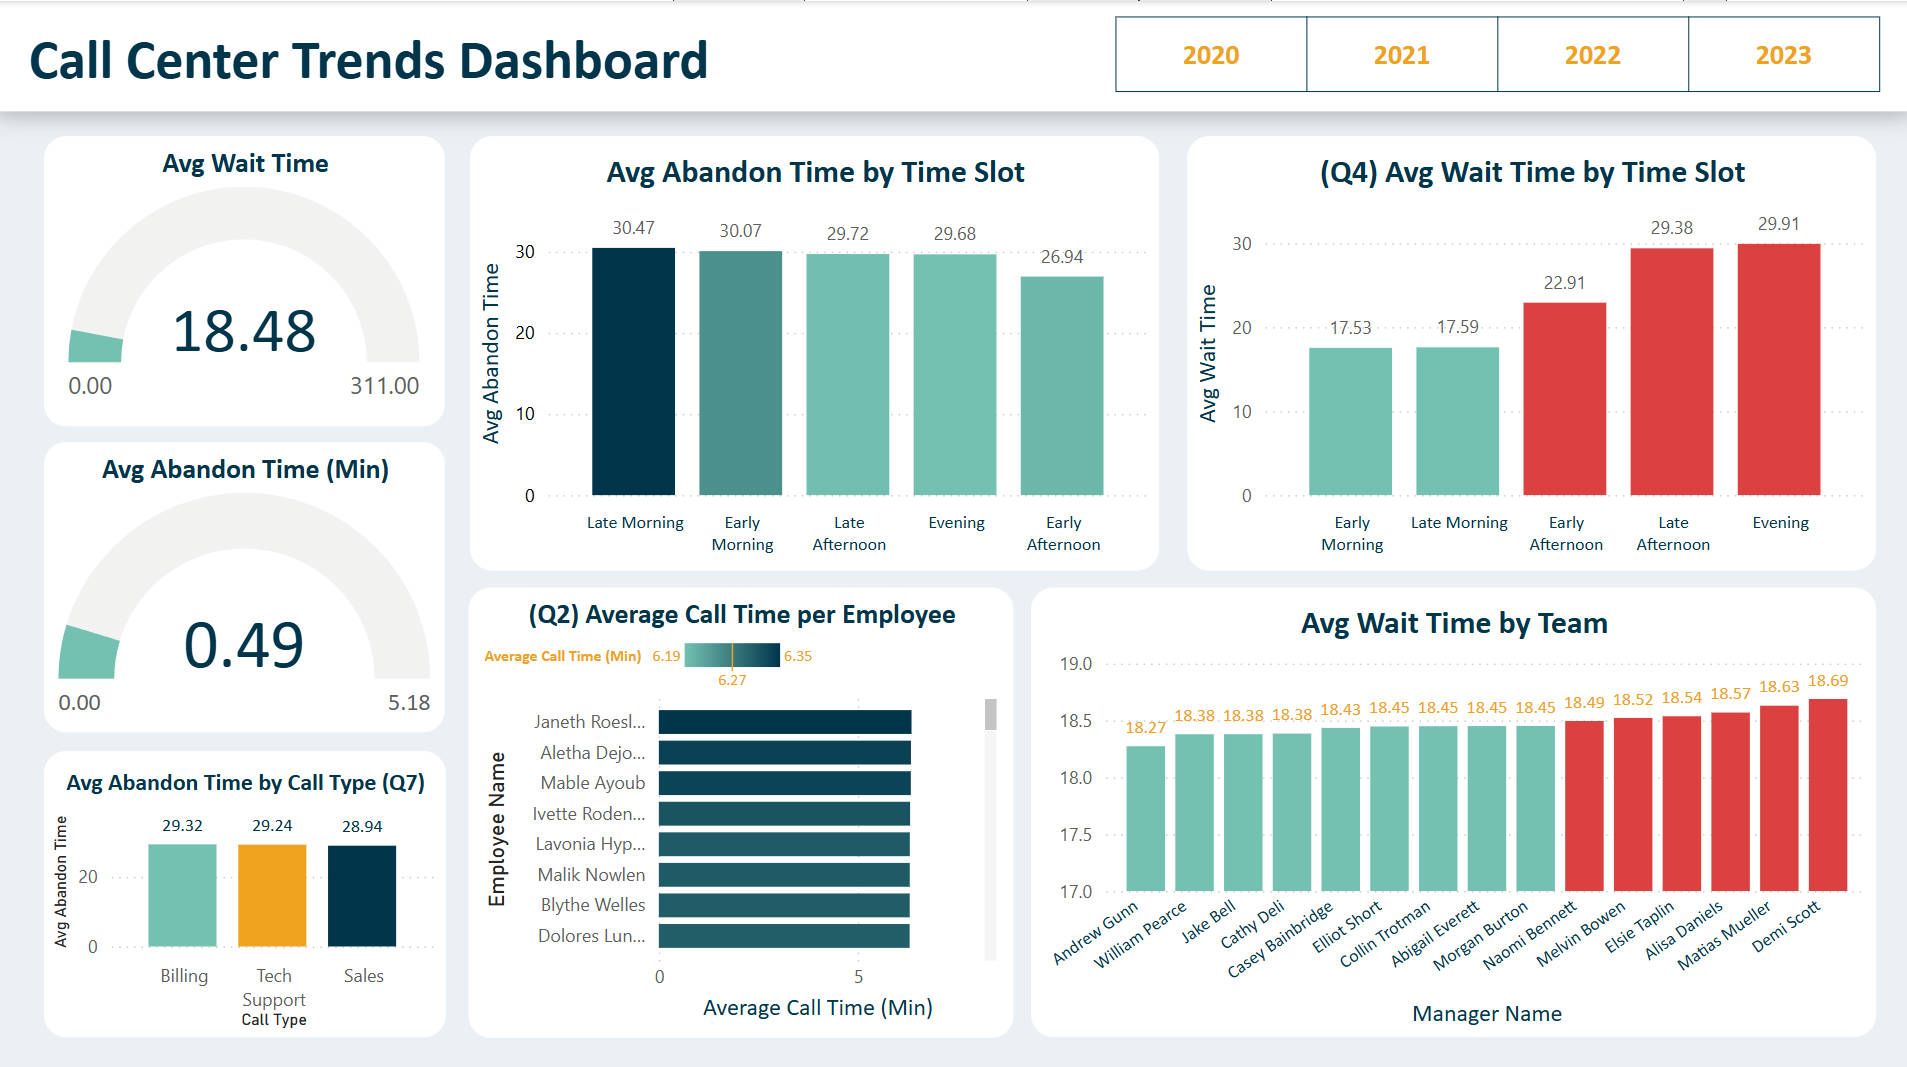
(3) Abandon & Wait
This page provides insights into customer drop-off behavior. It includes average waiting time by time segment, and abandon time by call type, helping managers identify when and why customers are hanging up. The visuals combine line and bar charts with slicers to support flexible filtering.
(4) Revenue
A compact yet impactful page showing revenue breakdown by U.S. states. Conditional formatting and sorting make it easy to identify which regions contribute most to the business, enabling geo-targeted marketing or staffing decisions.
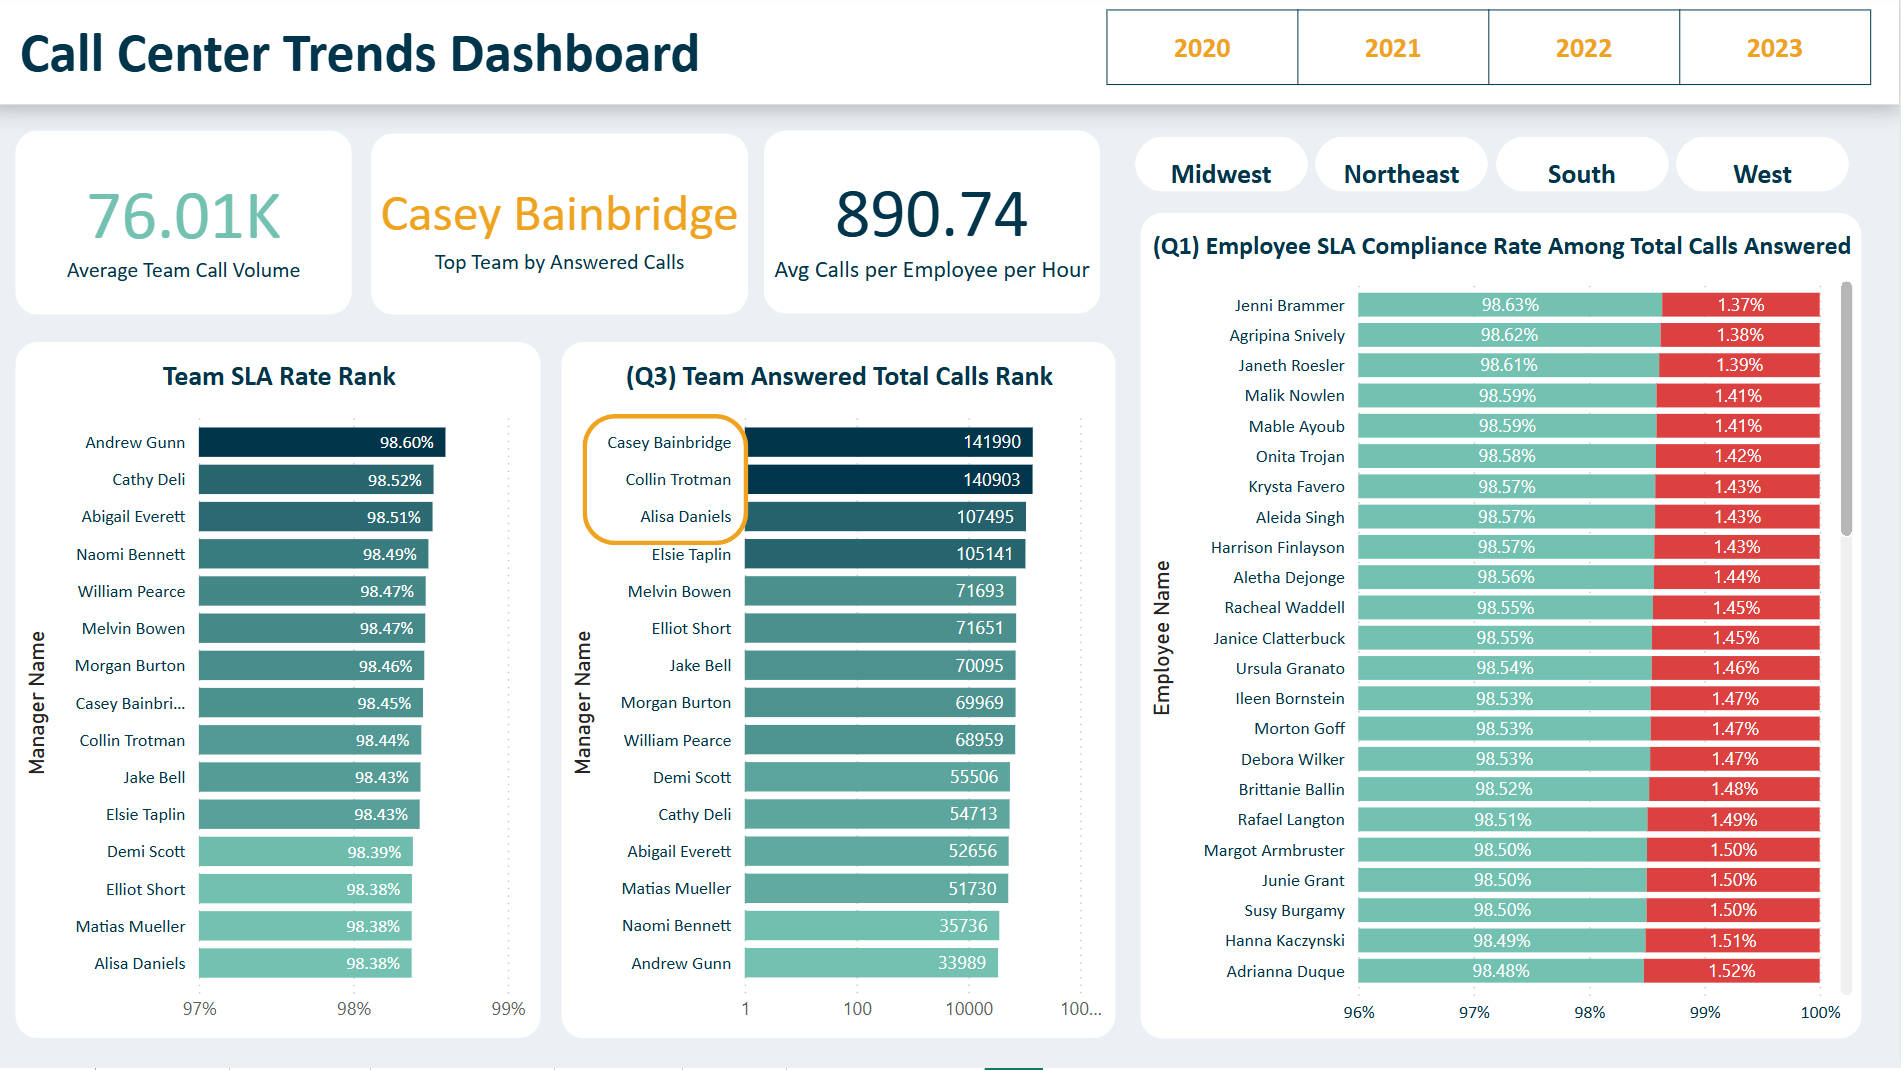
(5) Team
Designed for management-level analysis, this page reveals which team managers oversee the most responsive teams, based on the number of calls answered and SLA compliance. Visual cues such as data bars and ranking indexes allow for fast comparison.
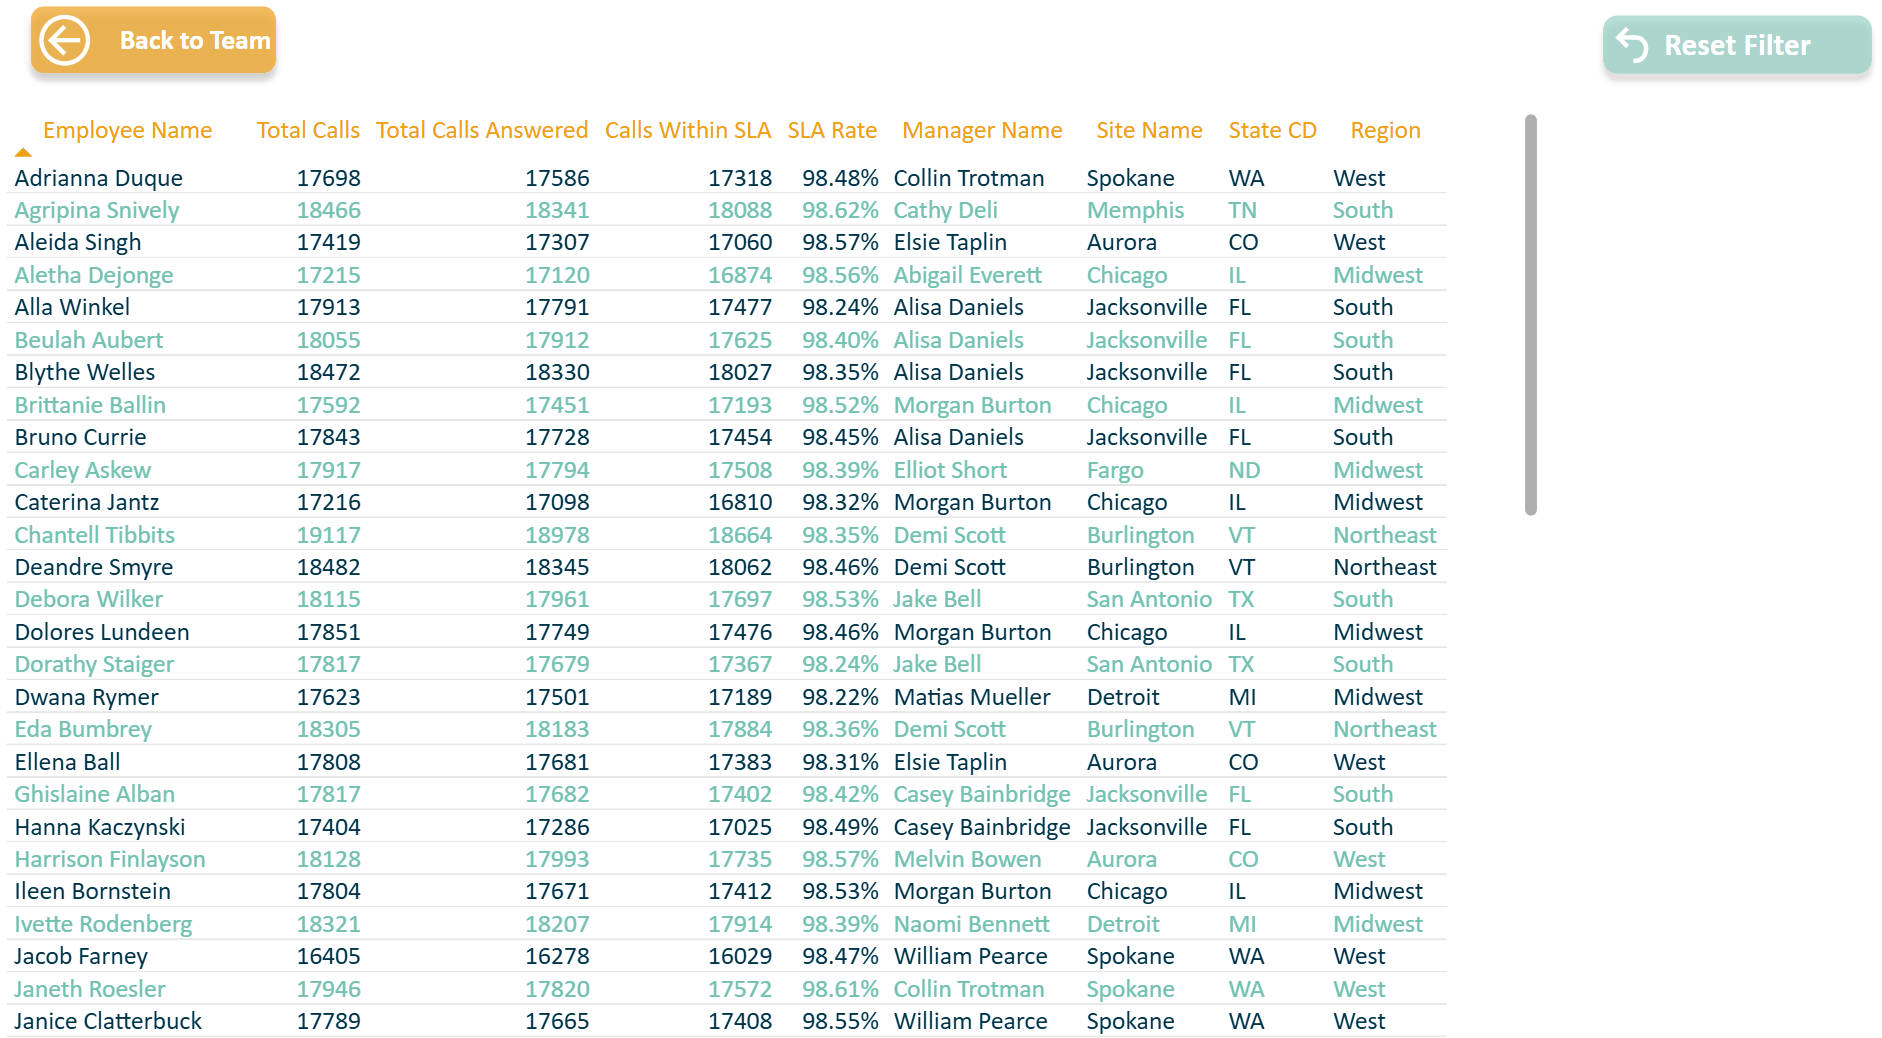
(6) Employee Details
A granular-level view into individual employee performance, including average call duration and SLA compliance per agent. This section is valuable for HR evaluation, training needs assessment, and incentive planning.
3.Technical Highlights
| Feature | Description |
|---|---|
| Power Query Transformation | Applied filters, splits, merges, and conditional columns for data cleansing. |
| DAX Measures | Developed custom formulas for SLA status, average duration, and abandonment. |
| Visual Design | Used bar charts, KPIs, time heatmaps, and slicers to communicate insights clearly. |
| Business Logic Integration | Incorporated SLA rules directly into DAX logic for accuracy. |
Data Disclaimer
All data used in this project is based on fictional or anonymized datasets provided for educational purposes only. The visualizations and KPIs are designed solely to demonstrate data analysis techniques and dashboard-building skills using Power BI.