
04 Python Streamlit – Car Sales Analysis Dashboard
Background
In this team project, we aimed to develop a data-driven dashboard that helps explore car sales dynamics across the United States.
Using a public dataset from Kaggle, we built a Streamlit app with multiple analysis pages. The dashboard supports interactive filtering, trend visualization, and regional & dealer-level performance analysis—empowering stakeholders with insight-driven decisions.
Multi-page dashboard providing sales, customer, and dealer insights.
I led the development of the dashboard logic and backend data handling, and took charge of the dealer performance analysis module.
1. Data Preprocessing & Transformation
- Used Pandas to handle missing values, convert date formats, and engineer time-based features (year, quarter, month).
- Applied filtering logic across region, brand, model, transmission type, etc., for customized drill-down analysis.
- Created derived metrics such as monthly sales, median car price, and sales share by region.
#data preprocessing
#convert date format
df['Date'] = pd.to_datetime(df['Date'], format='%d/%m/%Y', errors='coerce')
df = df.dropna(subset=["Date"])
df['Year'] = df['Date'].dt.year.astype(str)
df['Quarter'] = df['Date'].dt.quarter.astype(str)
df['Month'] = df['Date'].dt.month.astype(str)

#general filters
st.sidebar.header("Filters")
selected_year = st.sidebar.multiselect("Select Year", df["Year"].unique(), default=df["Year"].unique().tolist())
selected_region = st.sidebar.multiselect("Select Dealer Region", df["Dealer_Region"].unique(), default=df["Dealer_Region"].unique().tolist())

#set default values if filters are empty
if not selected_year:
    selected_year = df["Year"].unique().tolist()
if not selected_region:
    selected_region = df["Dealer_Region"].unique().tolist()
2. Dashboard Building with Streamlit
I designed and implemented a multi-page Streamlit app, allowing users to explore the dataset from different angles. Each page serves a specific analytical purpose and is equipped with interactive components and clean visualizations.
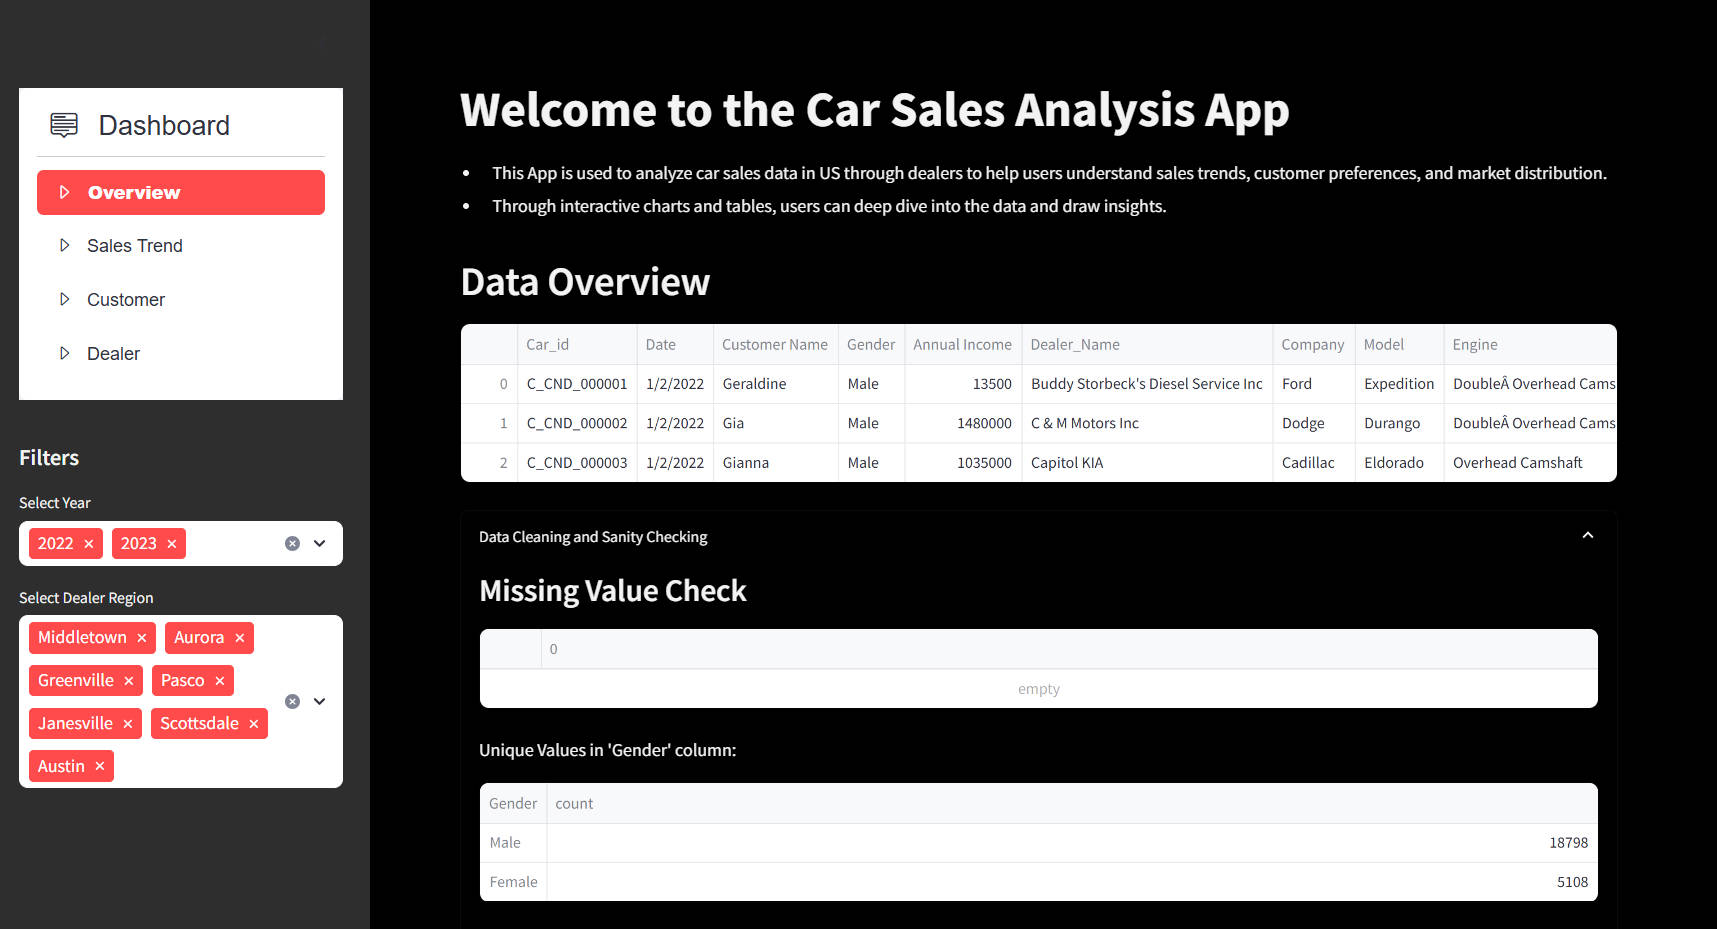
Overview
Introduces the purpose of the app and provides a quick snapshot of the dataset. Users can explore sample data, review missing value checks, and examine key variables through histograms.
Sales Trend
Overall sales volume and revenue trends over time—by year, quarter, and month. Users can also compare performance across years and apply filters to focus on specific regions or car attributes. 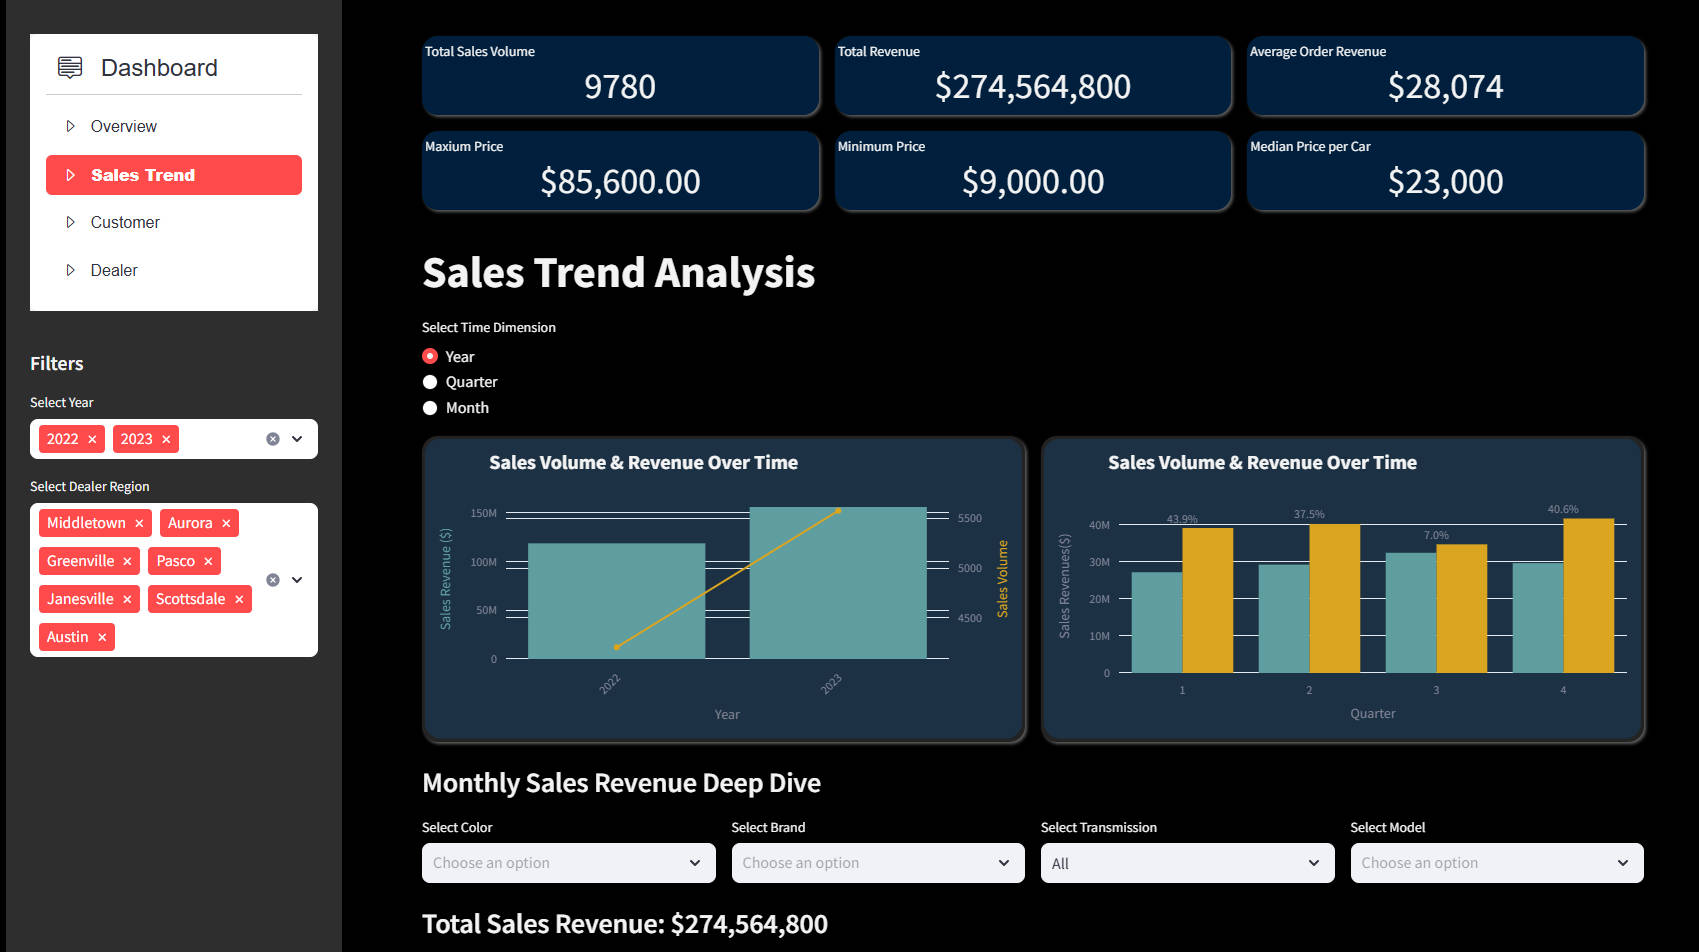
Customer Behavior
Analyzes customer demographics and preferences, such as top brands, popular models, and color choices. Visual elements include pie charts, bar charts, box plots, and heatmaps showing gender–body style relationships. 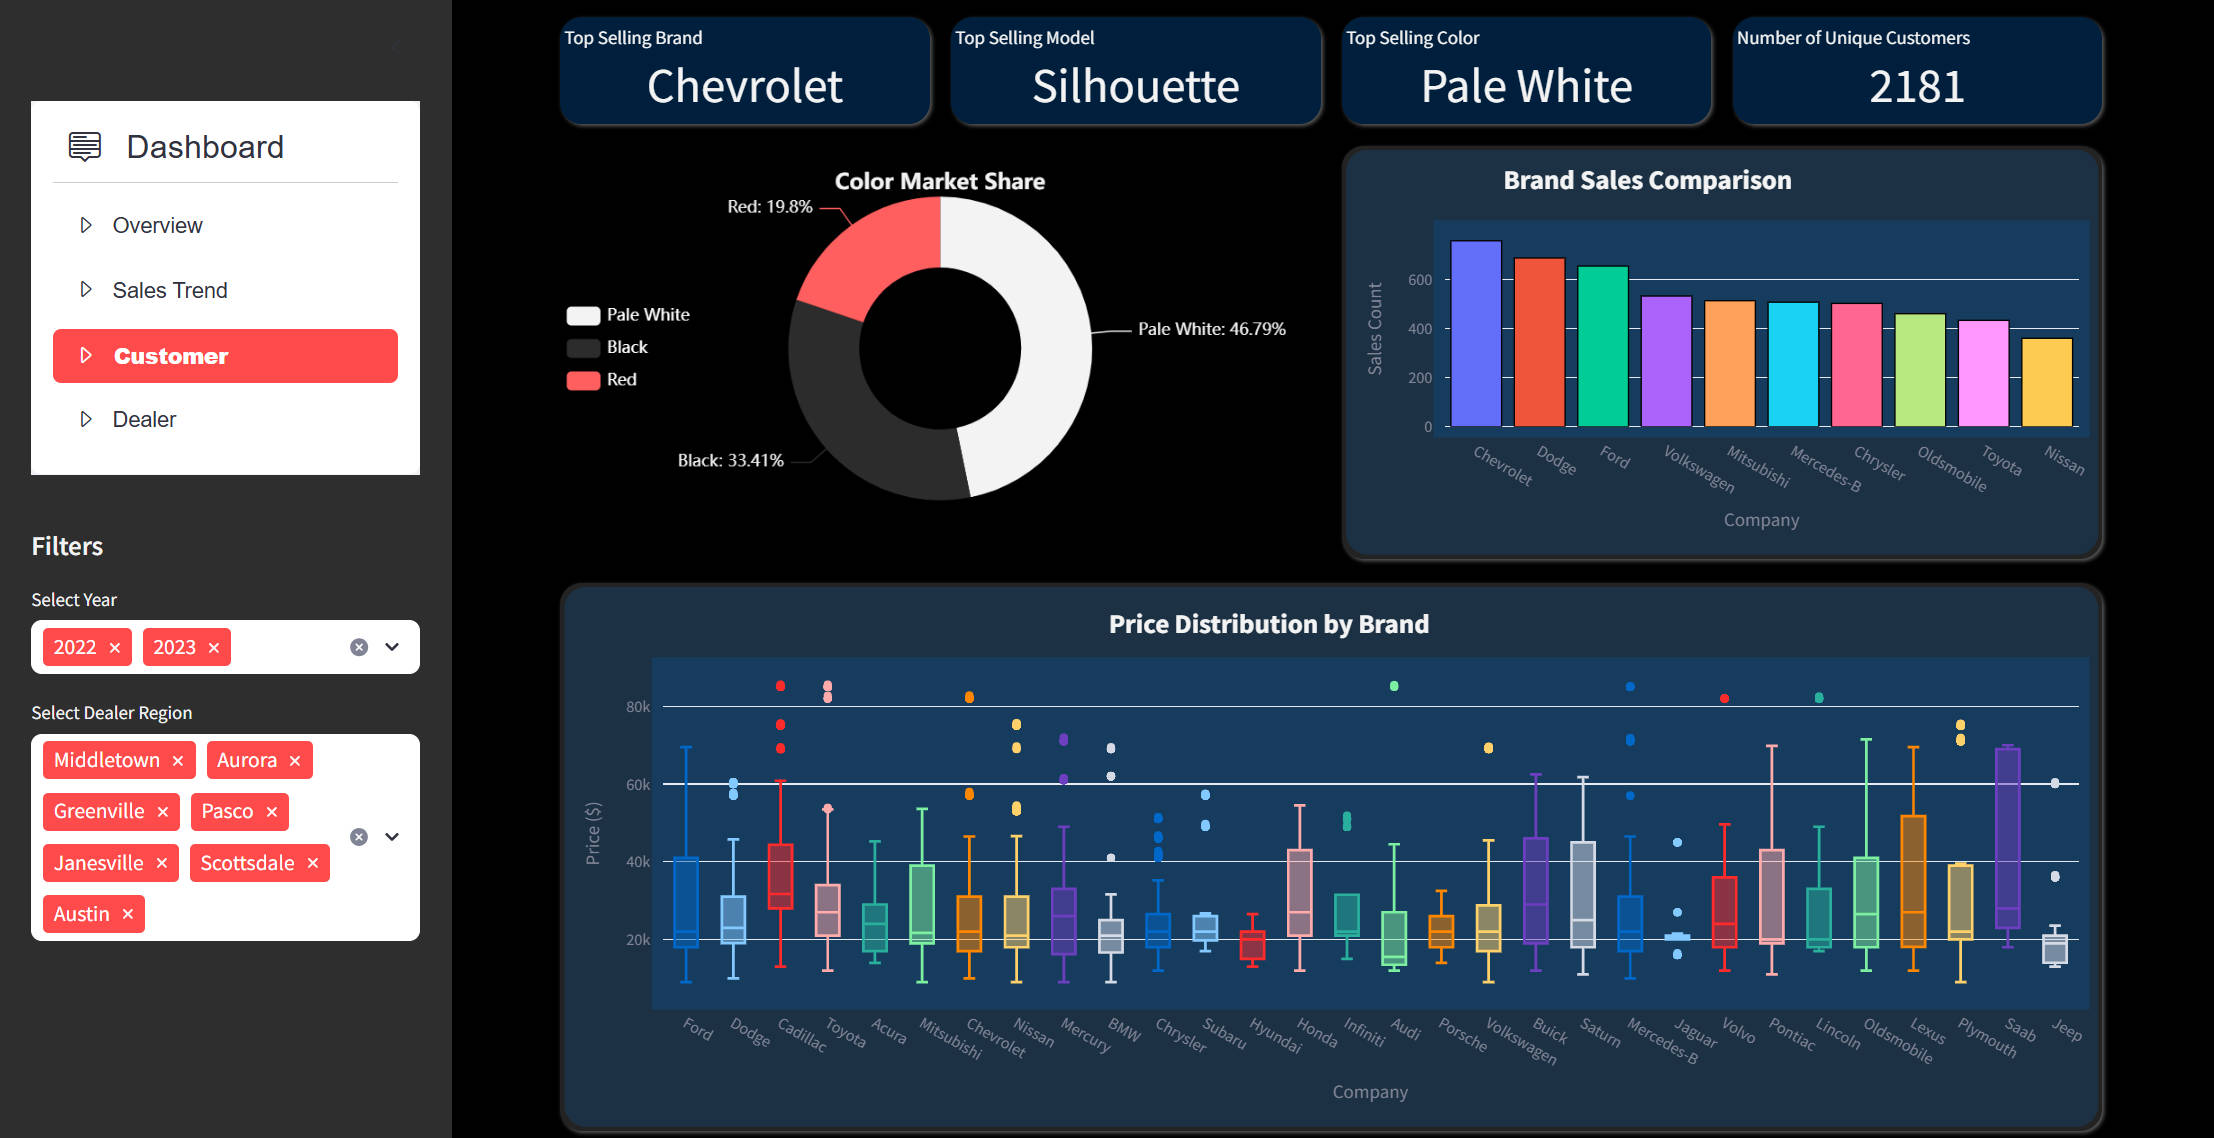
Dealer Performance
This page focuses on evaluating dealership activity, showing top-performing dealers, brand-model combinations, and regional market share. Includes a U.S. map with side-by-side bar charts and a time series line chart tracking monthly sales share per region. 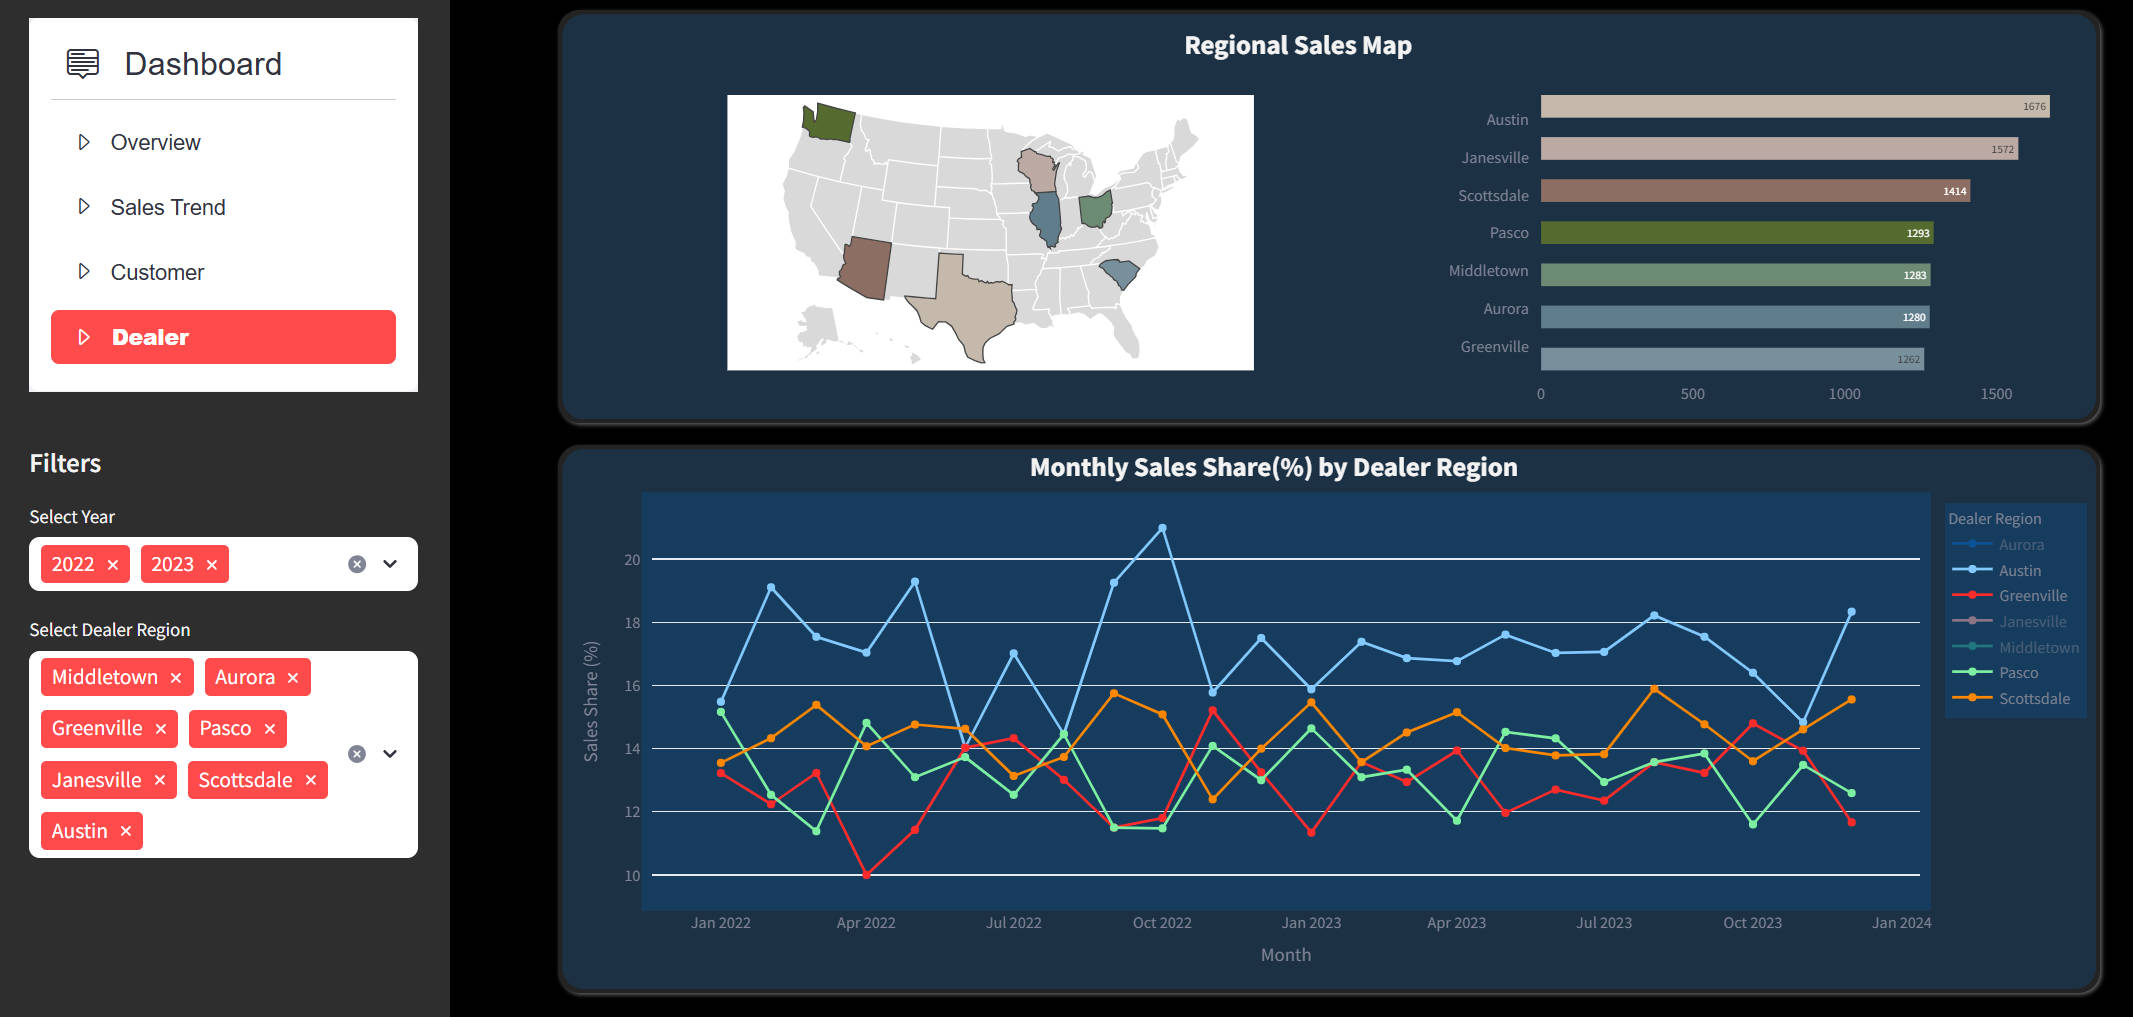
def plot_dealer_sales(filtered_df):

        #calculate dealer sales volume
        dealer_sales = filtered_df.groupby('Dealer_Name').size().reset_index(name='Sales')

        #sort
        dealer_sales = dealer_sales.sort_values('Sales', ascending=True)
        top10_dealer = dealer_sales.head(10)

        top10_dealer['shorter_name'] = top10_dealer['Dealer_Name'].apply(lambda x: x[:20] + '...' if len(x) > 20 else x)

        #create bar chart
        fig_dealer = px.bar(
            top10_dealer,
            y='shorter_name',
            x='Sales',
            orientation='h',
            title='TOP10 Dealer Sales Performance',
            labels={'shorter_name': 'Dealer Name', 'Sales': 'Sales Count'},
            text_auto=True,  #show sales volume on bars
            color='Dealer_Name',  #assign different colors to each dealer
            color_discrete_sequence=px.colors.qualitative.Prism  #set color sequence
        )
3.Technical Highlights
- Data cleaning, feature engineering, and exploratory data analysis with Python.
- Full dashboard built with Python for business use cases using Streamlit.
- Turning raw data into visual insights that help stakeholders understand trends and make decisions.
Data Disclaimer
All data used in this project is based on a simulated dataset from kaggle.com for educational purposes. The analysis and results are intended for demonstration only.