
05 R Shiny – Harmony Hub: Spotify Music Analysis & DJ Tool
Background
For my own interest, I wanted to build a tool that connects data analysis with real-world music selection scenarios—especially from a DJ or music producer’s perspective.
I used a cleaned public dataset extracted from the Spotify API, covering thousands of tracks with features like tempo, energy, key, and genre. I built the app using R Shiny, designing two main modules: a music analysis dashboard and a search-based DJ support tool.
Multi-tab app for exploring song attributes and finding compatible tracks.
My Core Contributions
I independently completed the full-stack development of the web app—from data cleaning to UI design to interactivity.
1. Data Preparation & Feature Engineering
- Parsed, cleaned, and formatted release dates, musical keys, and mode labels.
- Mapped key values (0–11) to music notation (C, D#, A, etc.), and converted mode to major/minor.
- Created a release year variable for time-based analysis.
- Used
dplyr,lubridate, andtreemapfor wrangling and visualization preparation.
# Process dates
# Process dates
all_clean_songs$track_album_release_date <- sapply(all_clean_songs$track_album_release_date, function(x) {
  tryCatch(as.Date(x, format = "%Y/%m/%d"), error = function(e) NA)})
all_clean_songs <- all_clean_songs[!is.na(all_clean_songs$track_album_release_date), ]
all_clean_songs$release_year <- as.integer(format(as.Date(all_clean_songs$track_album_release_date), "%Y"))

# Process mode column, convert 0,1 to minor,major
all_clean_songs$mode_name <- ifelse(all_clean_songs$mode == 1, "major", "minor")
2. Interactive Dashboard Design
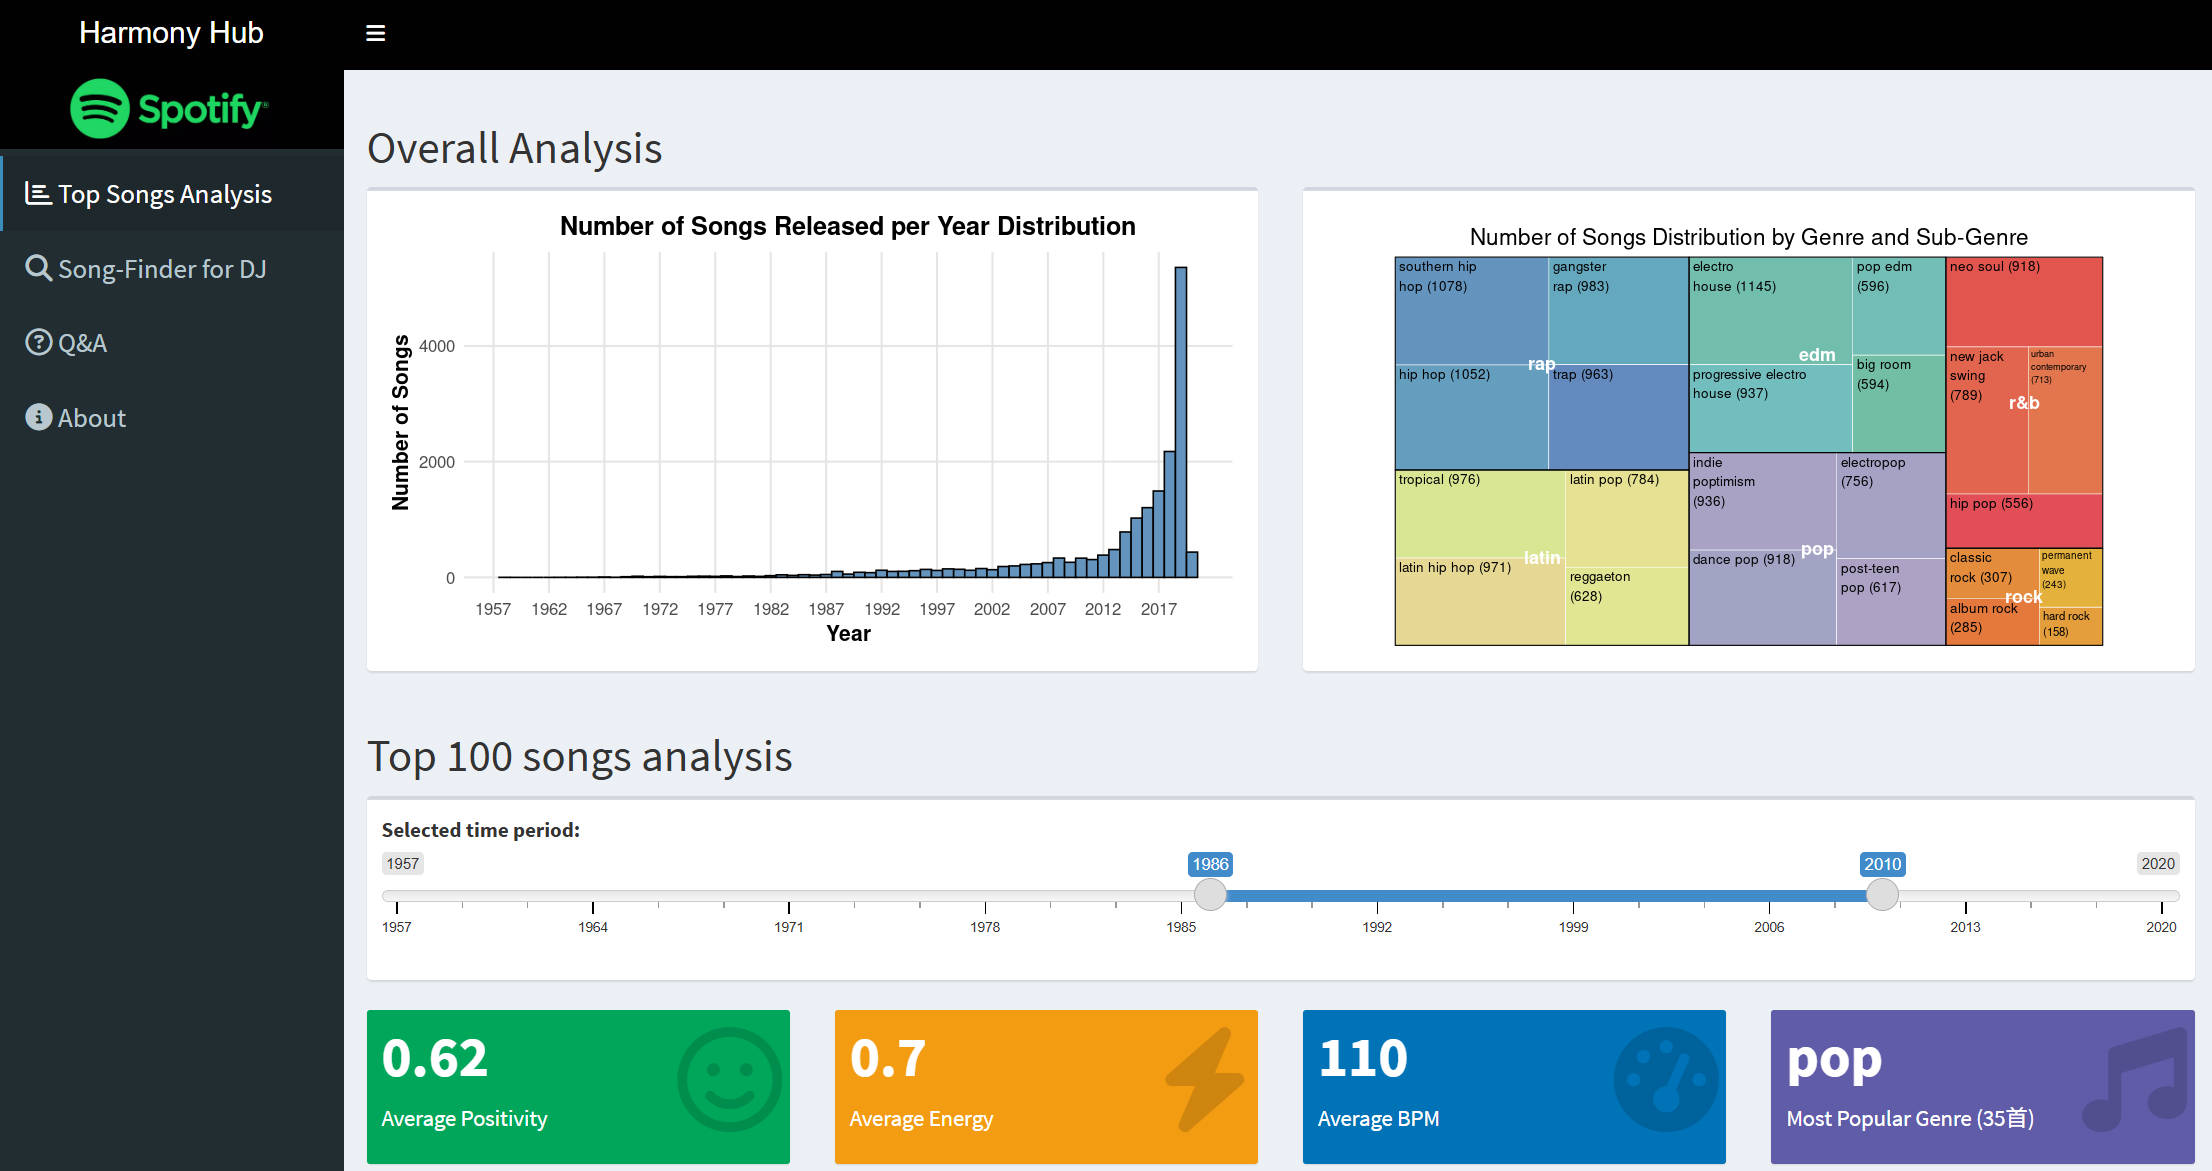
- Built a dashboard page called “Top Songs Analysis” with the following features:
- Yearly release histogram showing trends from 1957 to 2020
- Genre + Subgenre tree map to visualize distribution
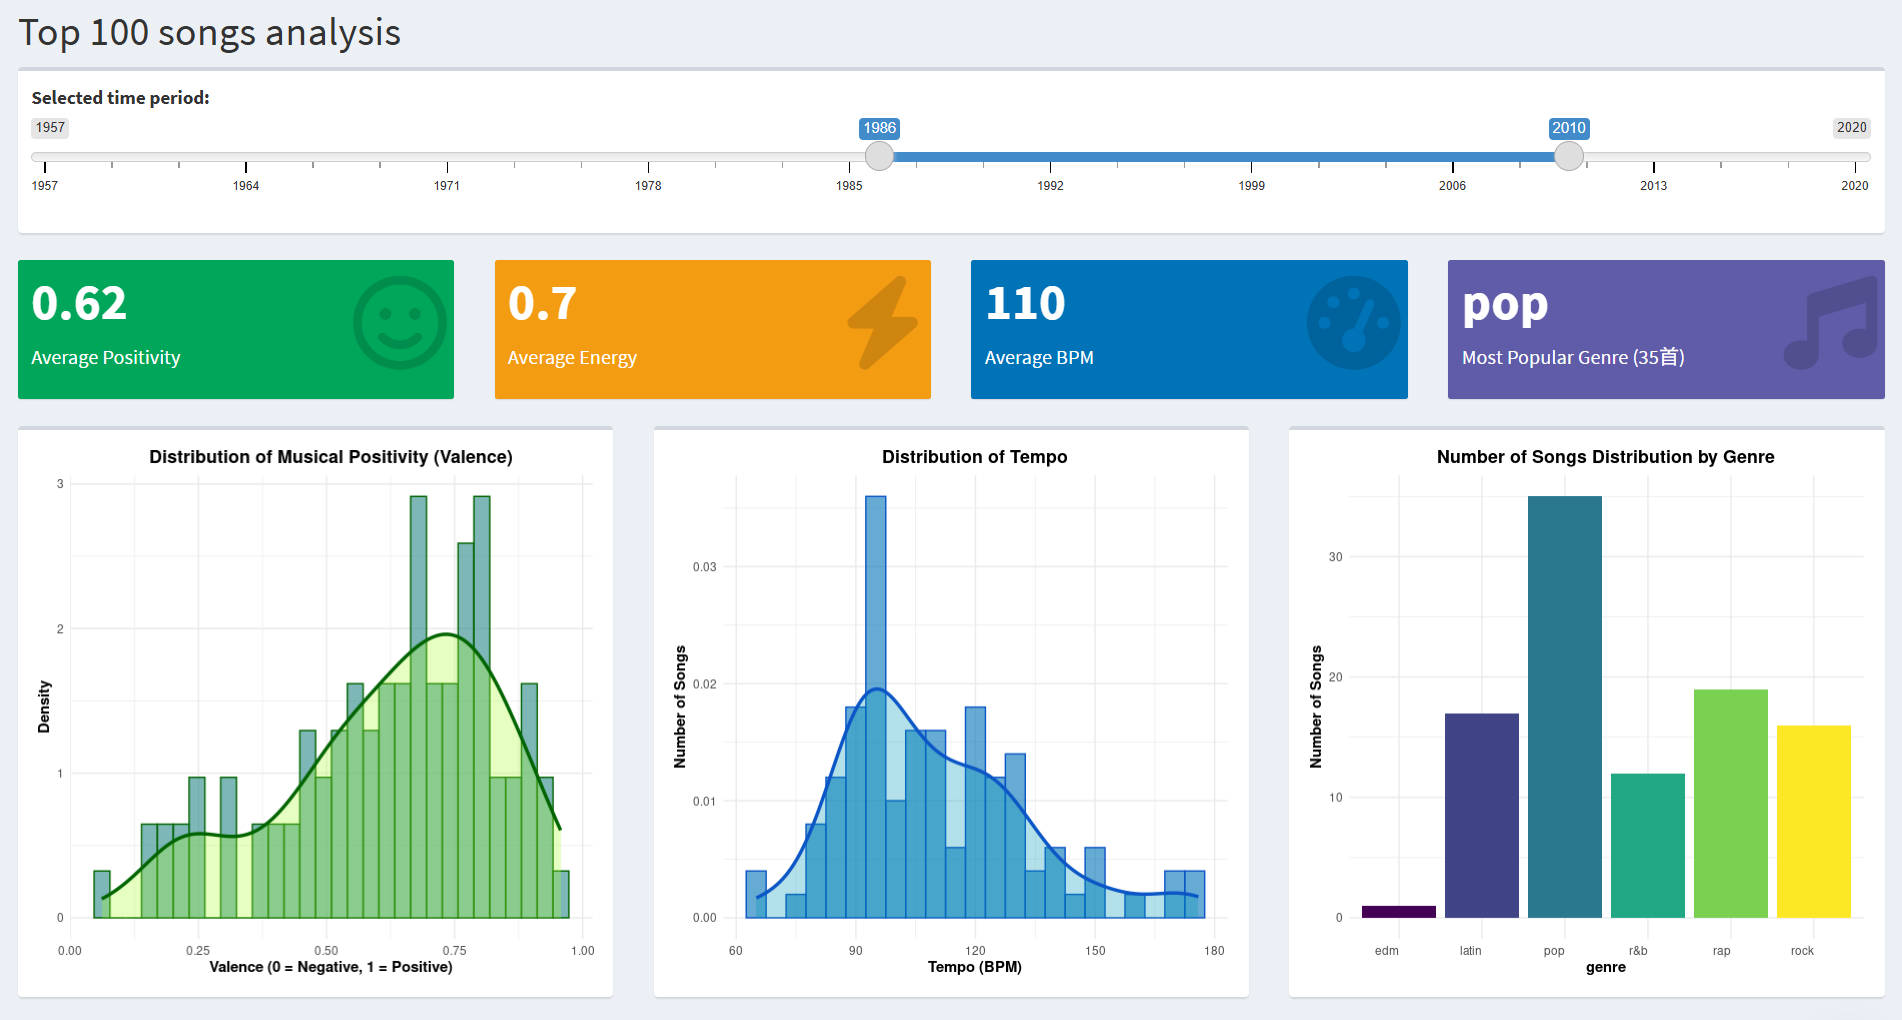
- Top 100 popular songs filtered by selected year range
- KPI cards showing average tempo, positivity (valence), energy, and dominant genre
- Distribution plots of musical positivity and BPM
- Interactive table to explore top songs with filters
Track-level analysis and top 100 songs based on selected time range.
# ==================== UI part==================== #
ui <- dashboardPage(

  # Overall dashboard setup
  dashboardHeader(title = "Harmony Hub"),

  # set the sidebar
  dashboardSidebar(
    tags$style(".sidebar-menu {font-size:18px;}"),
    tags$img(src ="logo.jpg", width ="100%", style ="margin-top:0px; margin-bottom:5px;"),
    sidebarMenu(
      menuItem("Top Songs Analysis", tabName= "top_songs", icon =icon("chart-bar")),
      menuItem("Song-Finder for DJ", tabName = "song_finder", icon = icon("search")),
      menuItem("Q&A", tabName ="qa", icon =icon("question-circle")),
      menuItem("About", tabName ="about", icon =icon("info-circle"))
    )
  ),
...
3. Song-Finder Tool for DJs
Created a dedicated DJ-oriented track search tool with intelligent filtering:
- Filter by track name, genre, subgenre, key, mode, and tempo (BPM)
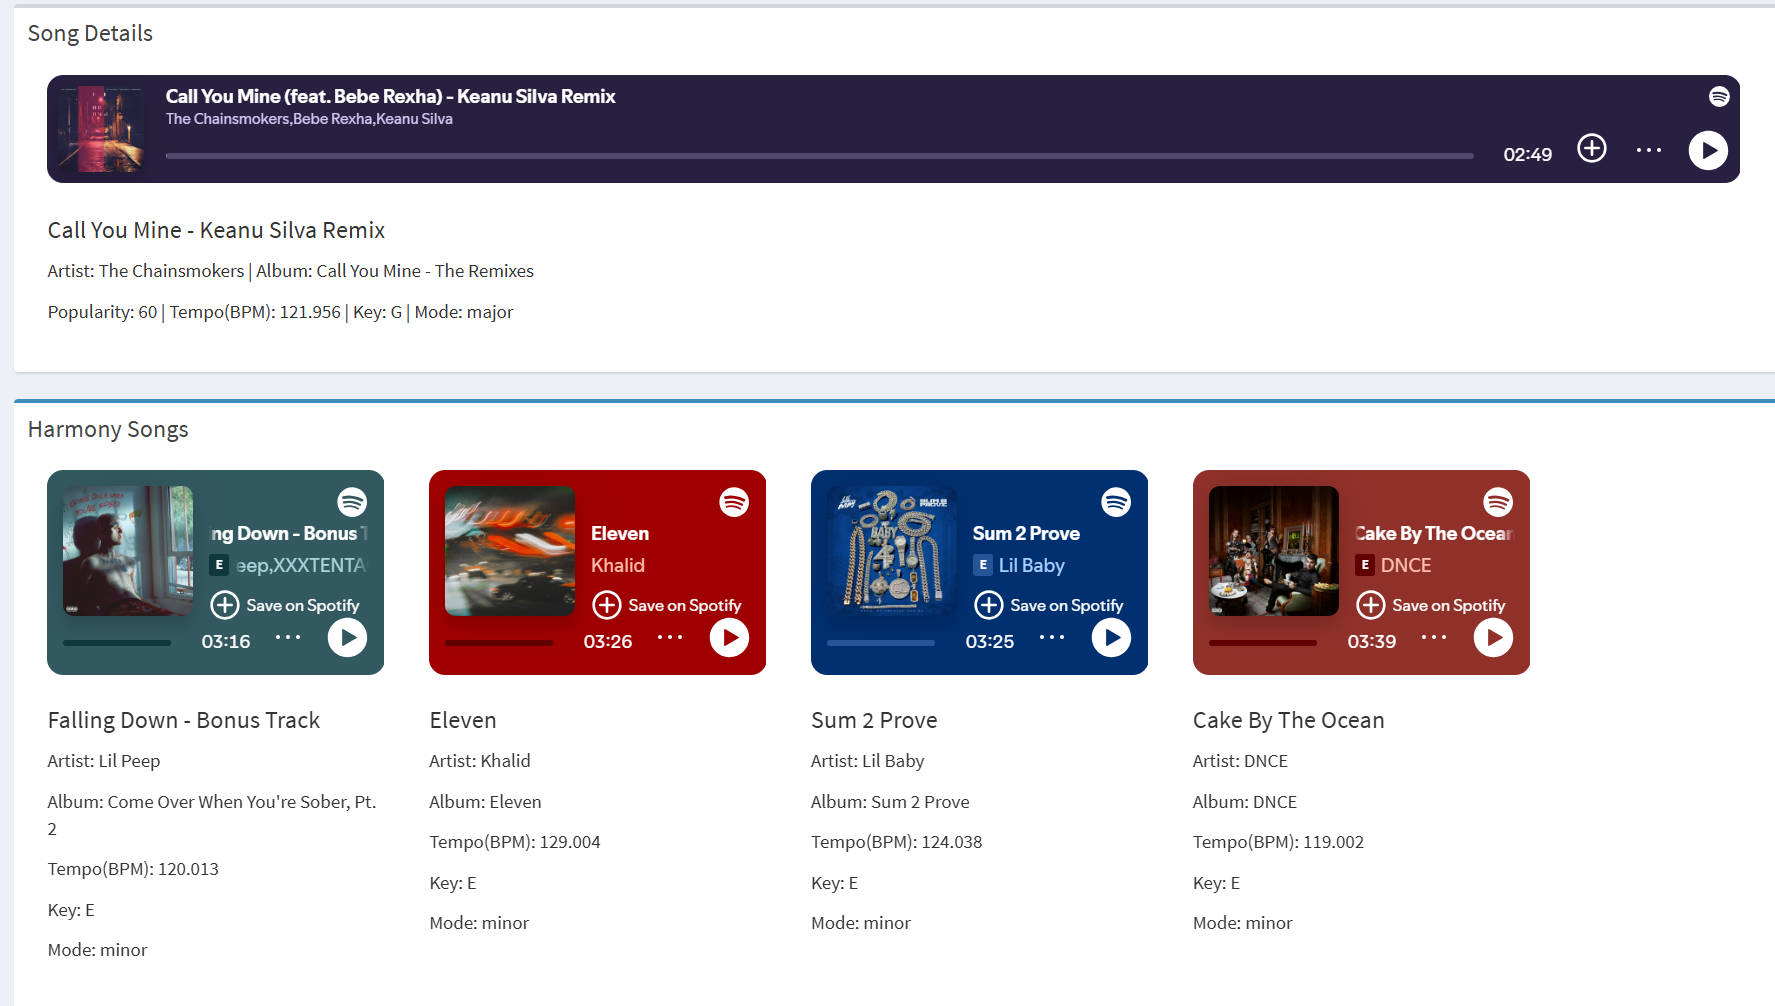
- Click on any result to display:
- Spotify embedded preview player
- Track attributes and popularity
- Show harmonic track suggestions based on music theory:
- Compatible BPM range (±10%)
- Harmonic key pairing (e.g., C major → A minor)
- Optional matching by energy & valence
- Built-in UI logic for dynamic subgenre population based on selected genre
DJ search tool with Spotify player and harmonic track recommendations.
Technical Highlights
| Feature | Description |
|---|---|
| R Shiny Framework | Built a modular UI + server app using shinydashboard and DT. |
| Music Theory Mapping | Converted numeric key/mode to readable formats for DJ usage. |
| Visualizations | Used ggplot2 and treemap for genre exploration and distribution plots. |
| Smart Filtering | Implemented multiple layers of filters across genres, keys, and tempos. |
| Spotify Integration | Embedded live track previews using Spotify iframe player. |
Data Disclaimer
This project uses a publicly available dataset based on Spotify API information (via Kaggle). The application and insights are created solely for educational and non-commercial purposes.